Tools
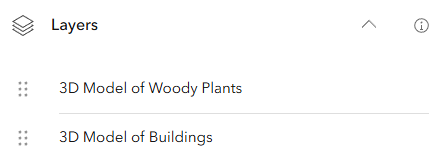
Layers
Display the layer of the 3D model of the city of Brno with the woody plants from the urban greenery register.
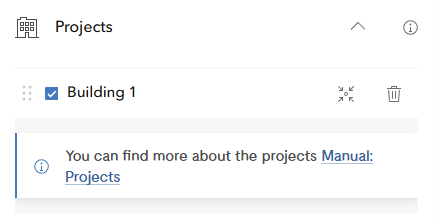
Projects
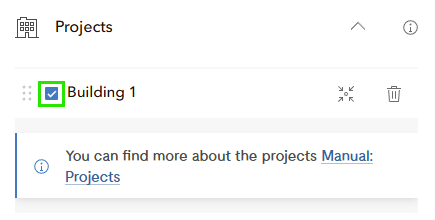
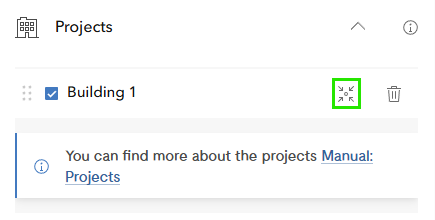
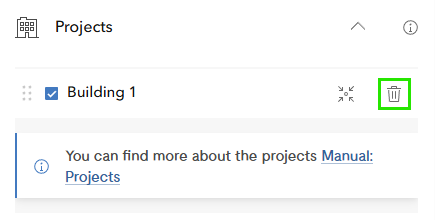
The projects are displayed here after the uploading the correct ZIP archives to the web application. These archives are either created by the widget Export to Project or by the ArcGIS Pro. You can turn on or off the uploaded project (Pic. 3), move to the model in the scene (Pic. 4), or even delete the project from the application (Pic. 5).
Insert 3D data
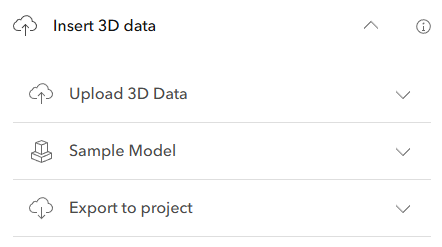
This widget serves for a work with own 3D models and projects. The subsection Upload 3D Data unfolds the upload process of the model or project, the section Export to Project clarifies, how the model can be exported to the project in the web application, and finally the section Data Preparation will guide you, how to correctly prepare the data in various software.
The widget comprises three tools. The first Upload 3D Data serves for uploading the models and projects to the application. The second Sample Model offers you an oportunity to experimentally place a sample model to the web scene. The third Export to Project exports the model into the project.
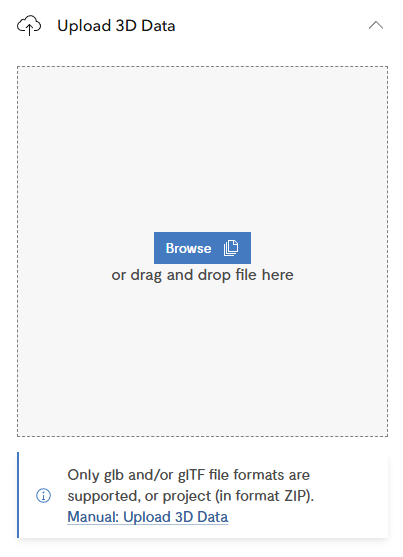
Upload 3D Data
Use the tool for uploading own model or project in two ways. The former one is to drag & drop the file to the square for uploading. The latter one is to search the file on your device using the button Browse. More about the process of uploading 3D data is mentioned in the subsection Upload the Model and/or the Project to the Web Application.
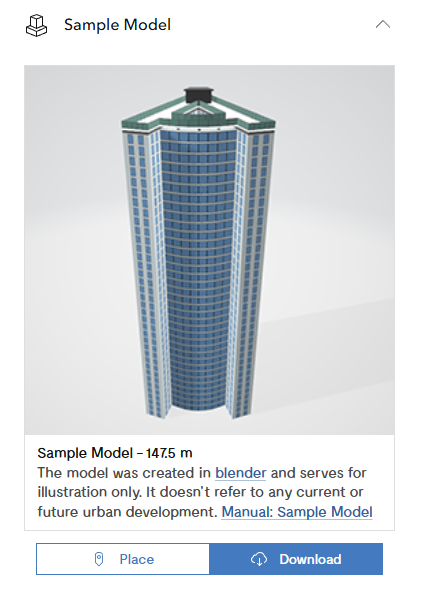
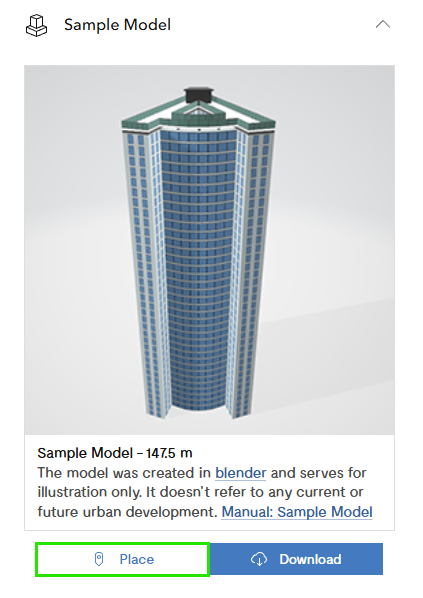
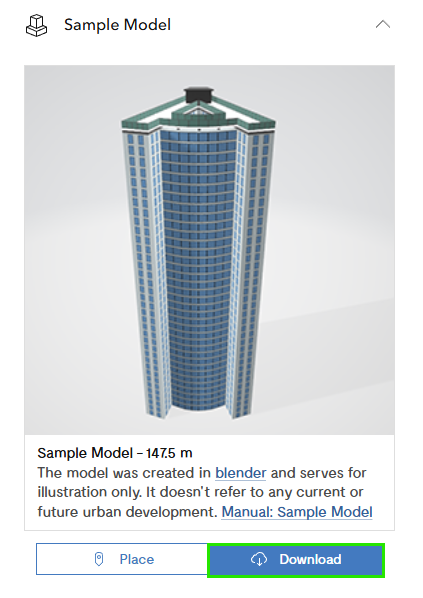
Sample Model
This tool serves for placing the sample model to the application (Pic. 8). The model can be placed (Pic. 9) to the web scene or can be downloaded (Pic. 10) and then by the tool Upload 3D Data can be uploaded and placed according to the instructions there.
The model was created in blender and serves for illustration only. It doesn't refer to any current or future urban development.
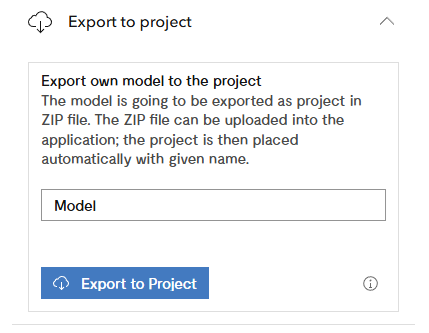
Export to Project
This tool serves for the export of the model to the ZIP archive, thus the project, in order to save its location in the web scene and, at the same time, enabling an easy sharing with other persons (more in the section Export to Project).
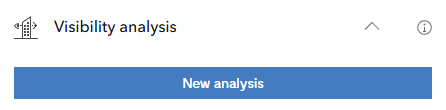
Visibility analysis
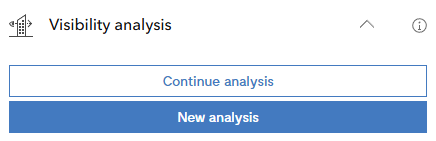
This widget serves for the visibility analysis from the selected observer point. The tool is activated by left click on the New analysis (Pic. 12).
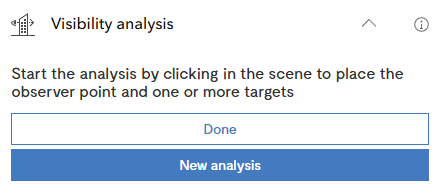
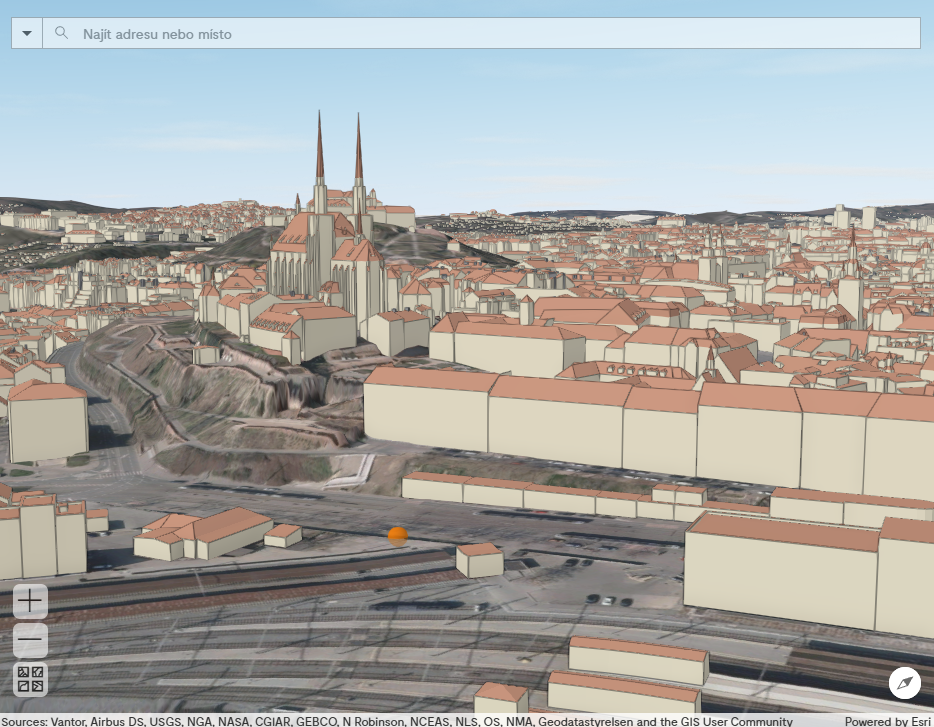
After the launch of the analysis, you are ask for an insertion of one observer point and one or more observed points (Pic. 13). The observer point (Pic. 14) and observed points (Pic. 15) snap to all objects which are in the web scene. Placement of each point is confirmed by the left click. Double click in the scene or left click to the button Done finishes the placement of the points (Pic. 13).
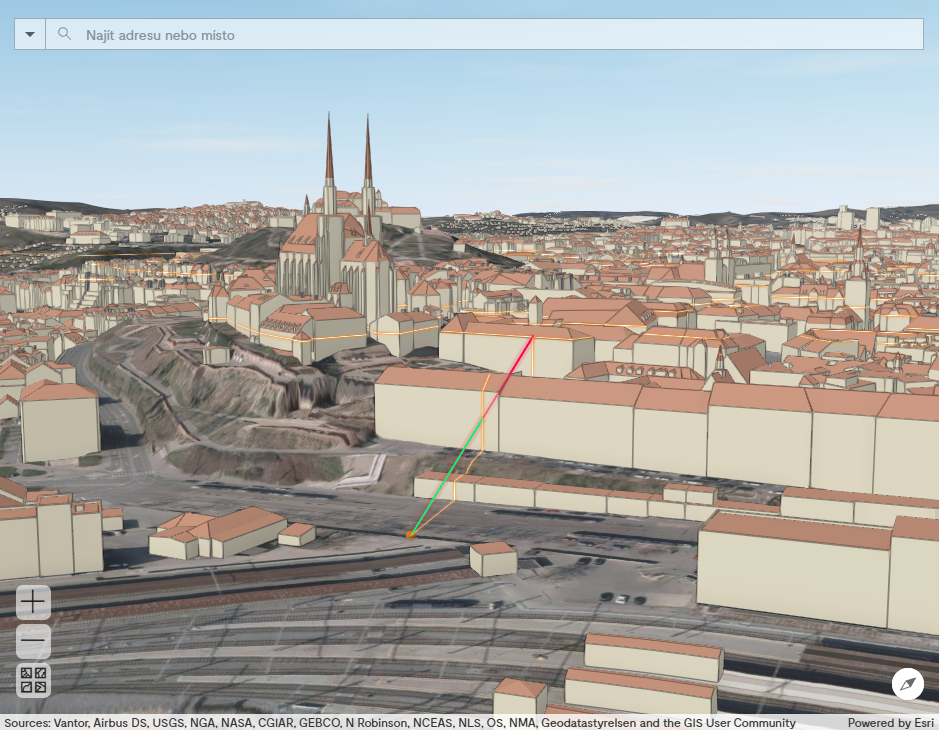
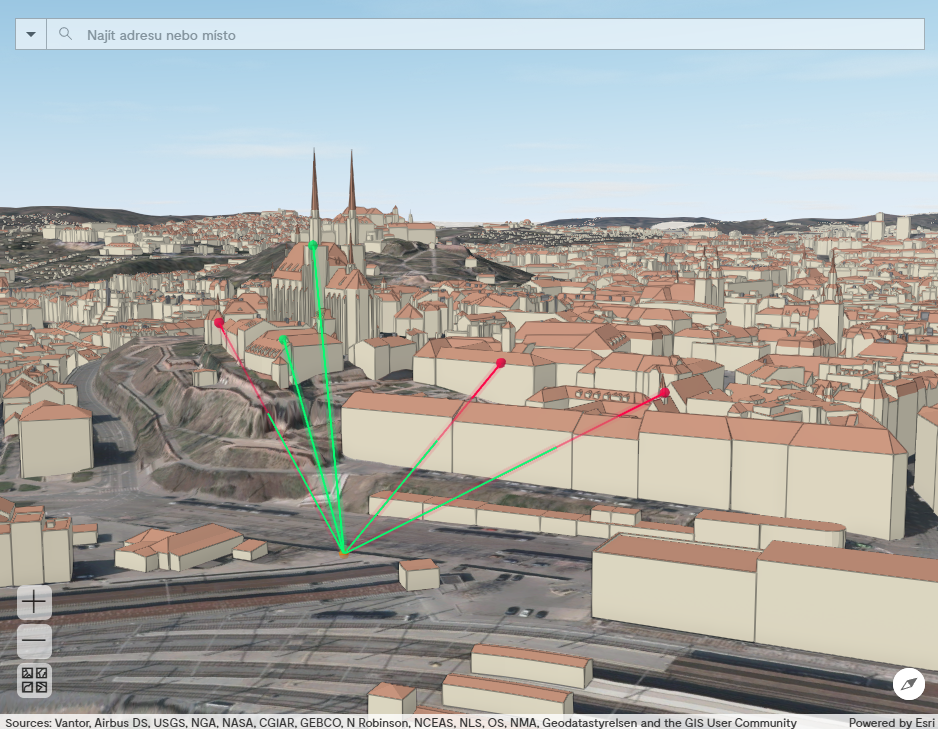
The analysis then creates lines among the observer and the observed points with a symbolized visibility. If the point is observable for the observer, the whole line is in green. On the other hand, if the point is hidden to the observer, the line is turned to a red colour from the point where it firstly intersects some obstacle (Pic. 15, Pic. 16).
When you need to edit some points or added new ones, click the button Continue analysis (Pic. 17). Or you can click on New analysis (Pic. 17) and start the new analysis.
The Locations of Protected View on Cityscape
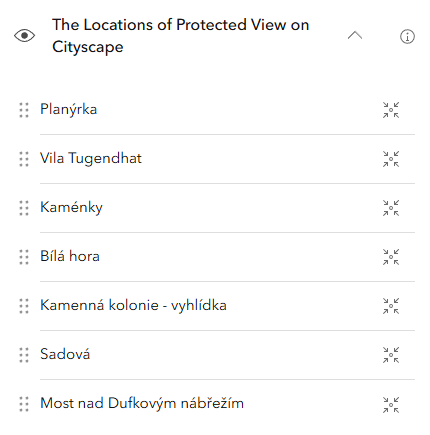
This tool serves for observing the city Brno from the locations of the protected view on cityscape (Pic. 19).
These views on the cityscape are defined in the current Master Plan of Brno (not in English).
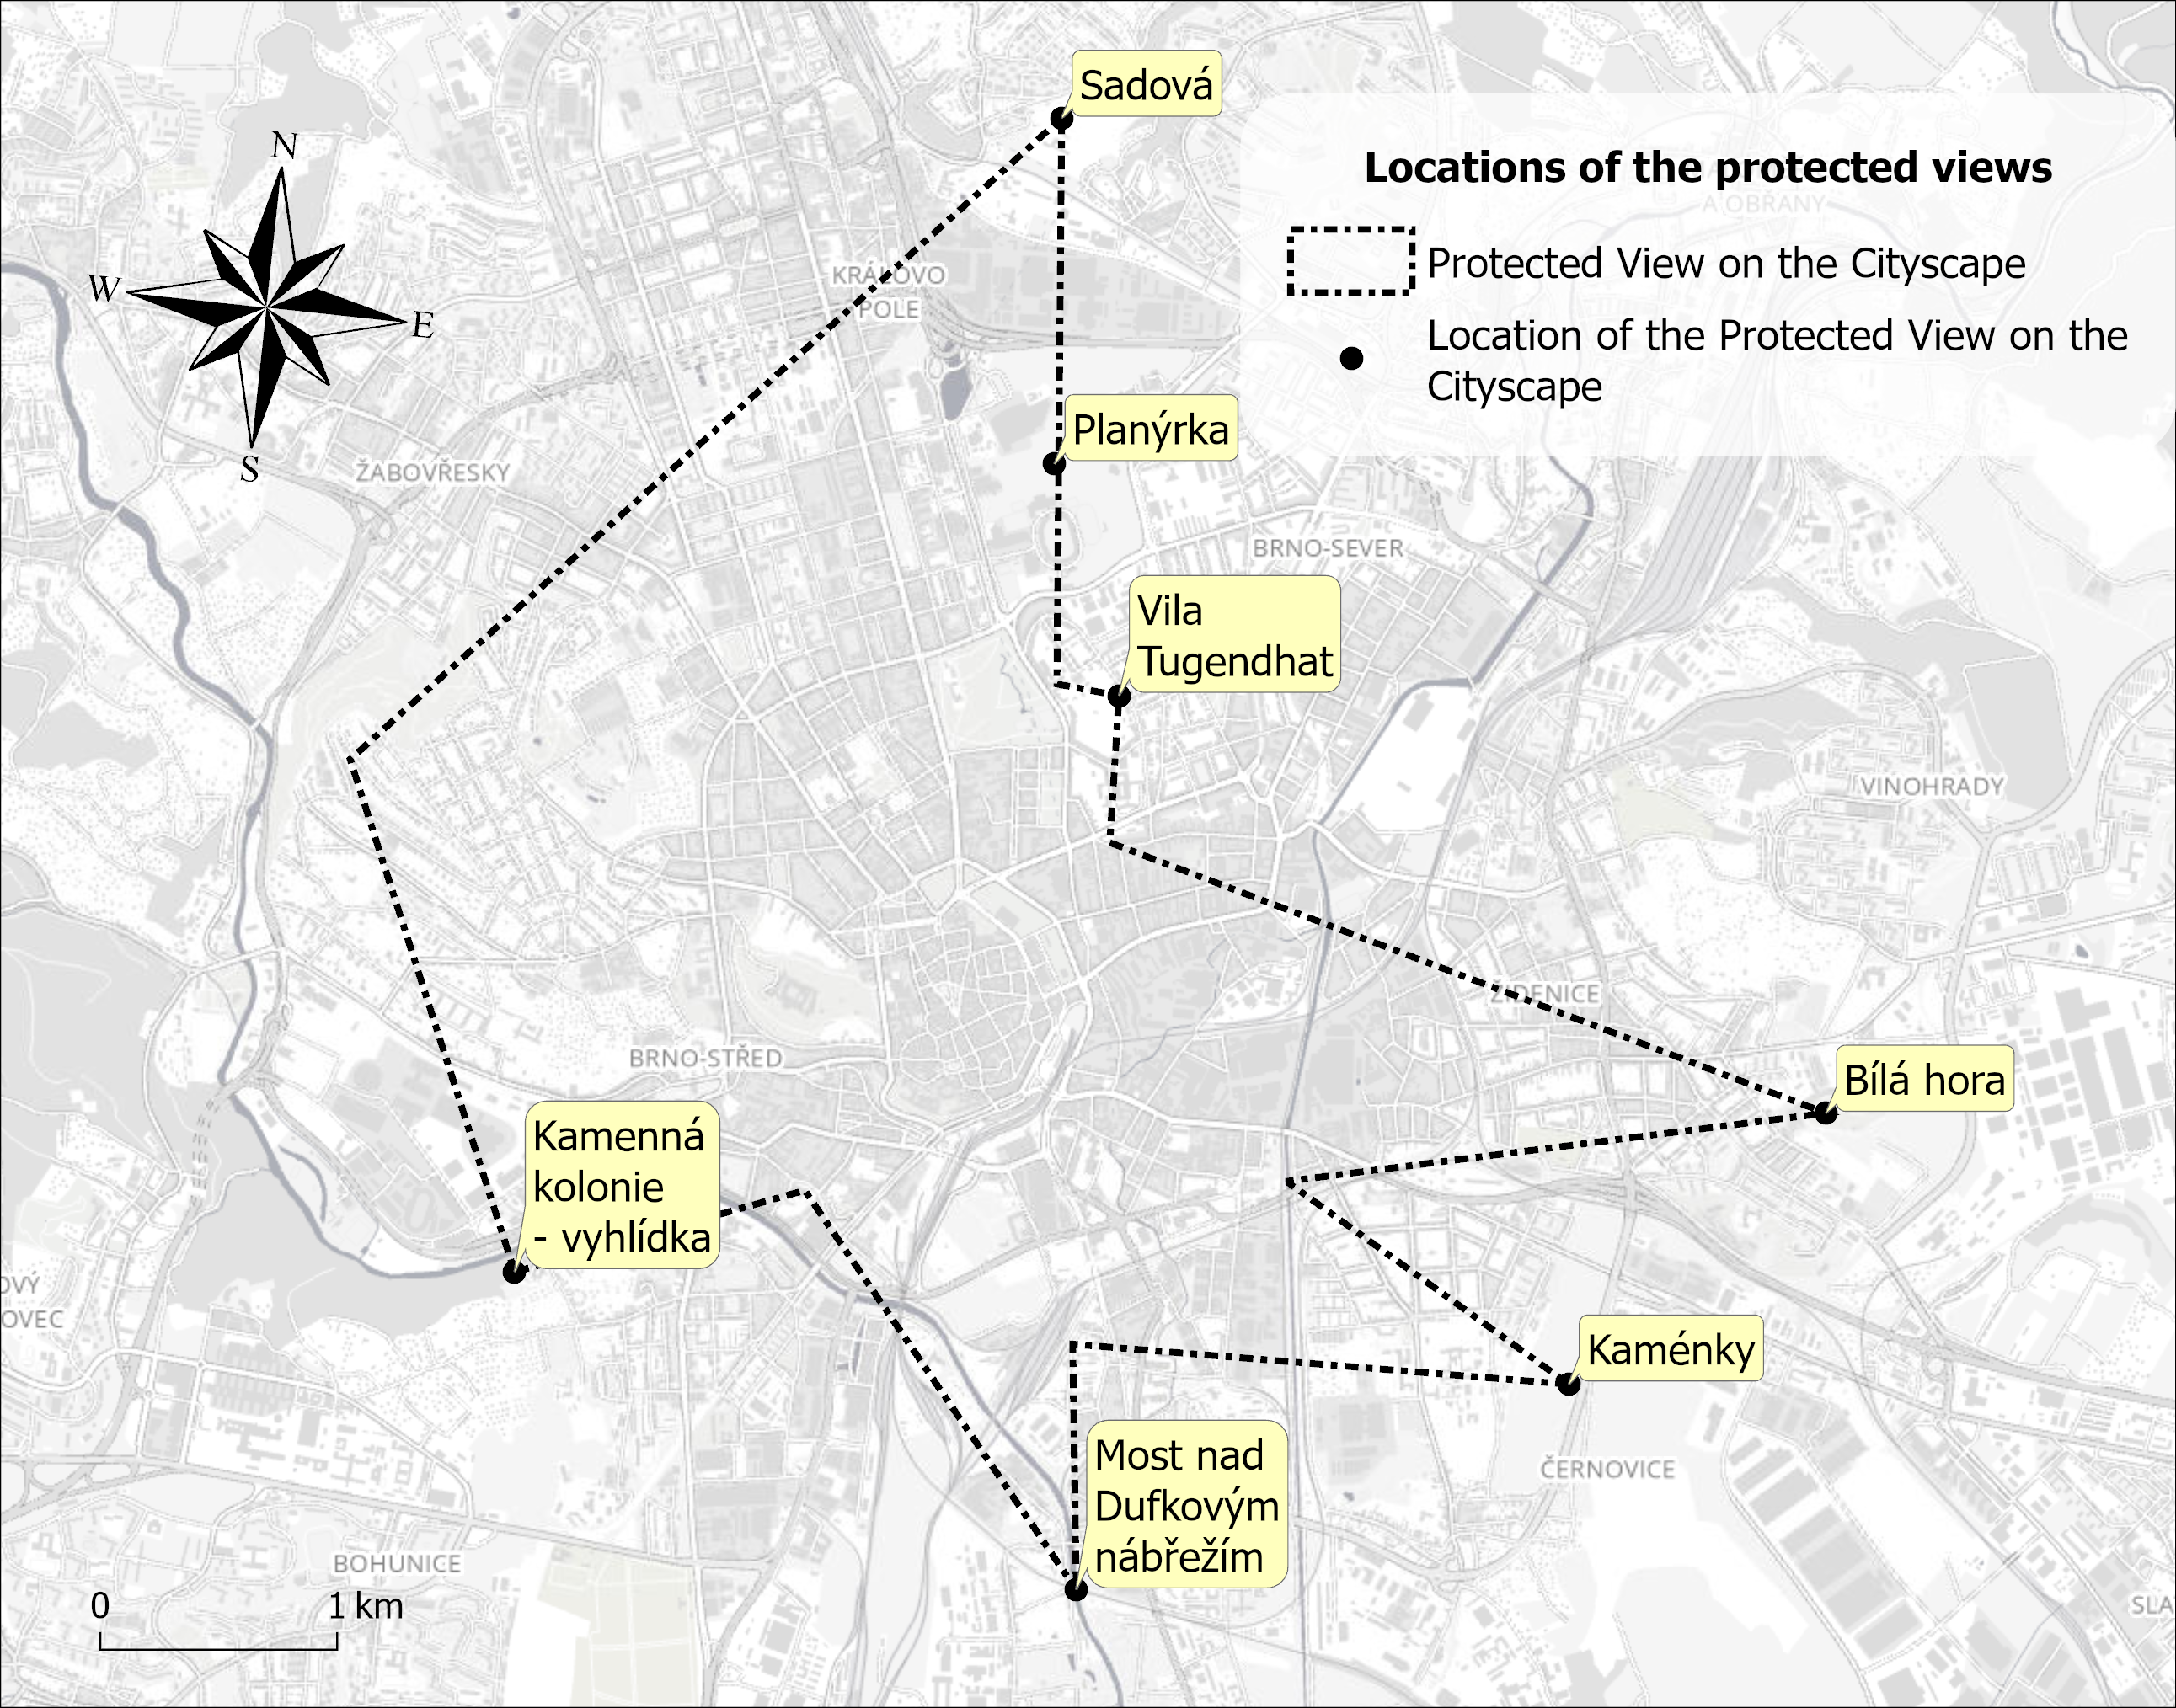
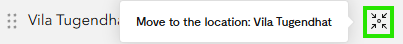
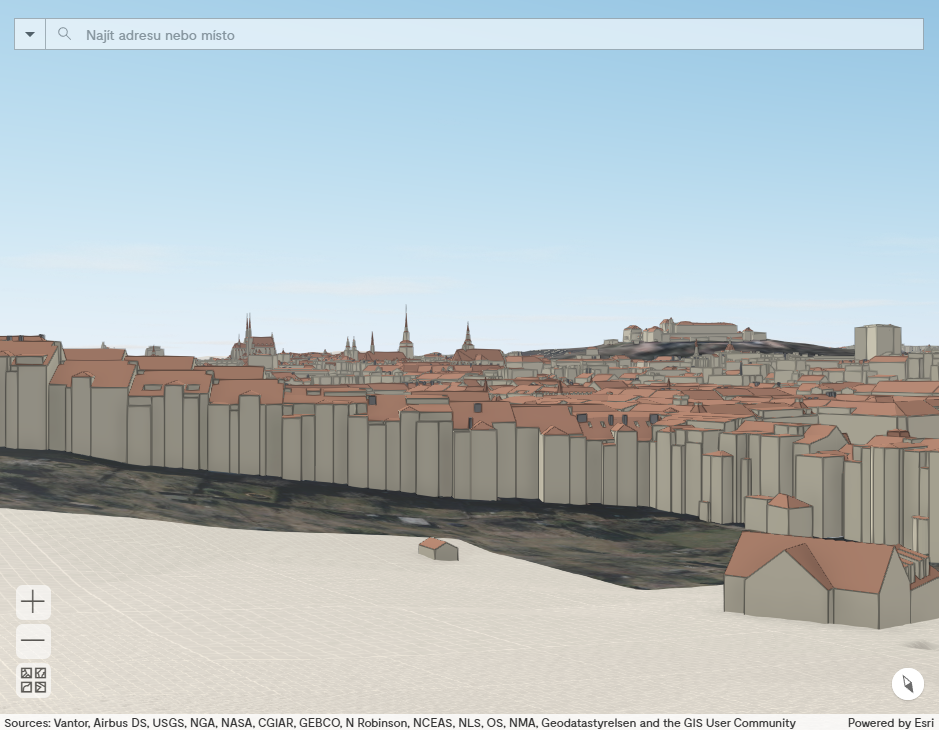
Click on the icon for moving to each locations in the list (Pic. 20) trigers the movement of the camera to the selected location (Pic. 21). The protected view is defined by a point with 1.7m height above terrain or some object.
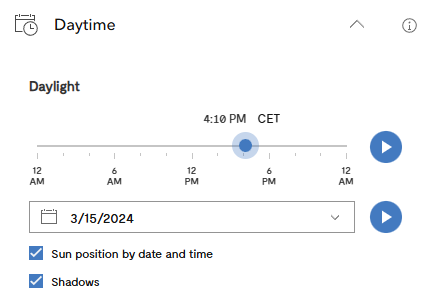
Daytime
The Daytime widget enables you to show the illumination throughout the day. You can set the specific day and time. Very usefull feature is displaying shadows, which applies to your own models as well. This means that you can verify the extent to which the new building affects the surrounding area with its shadow (Pic. 23).
Weather
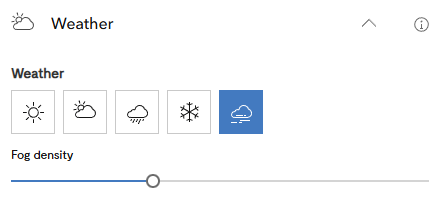
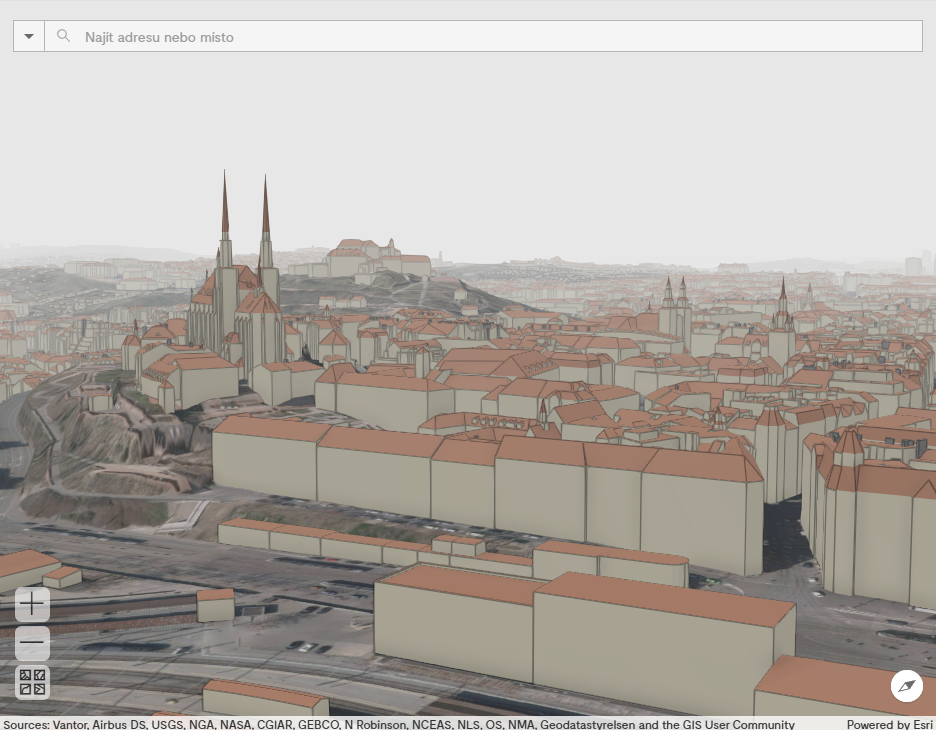
This widget enables you to choose the weather effects in the scene. There is a sunny day, clouds, fog (Pic. 25), rain or snow.
Measure
This widget serves for measuring distance, height and area in the web scene. Each tool snaps to the all objects in the web scene.
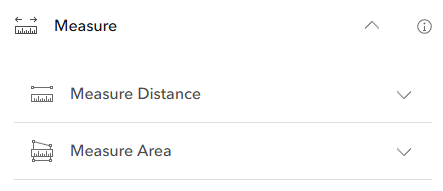
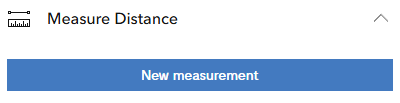
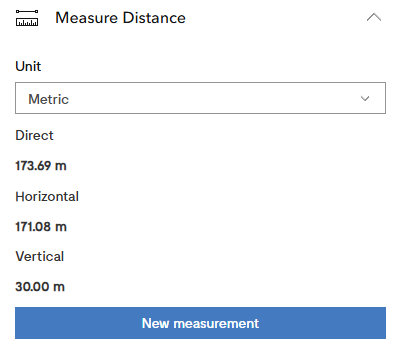
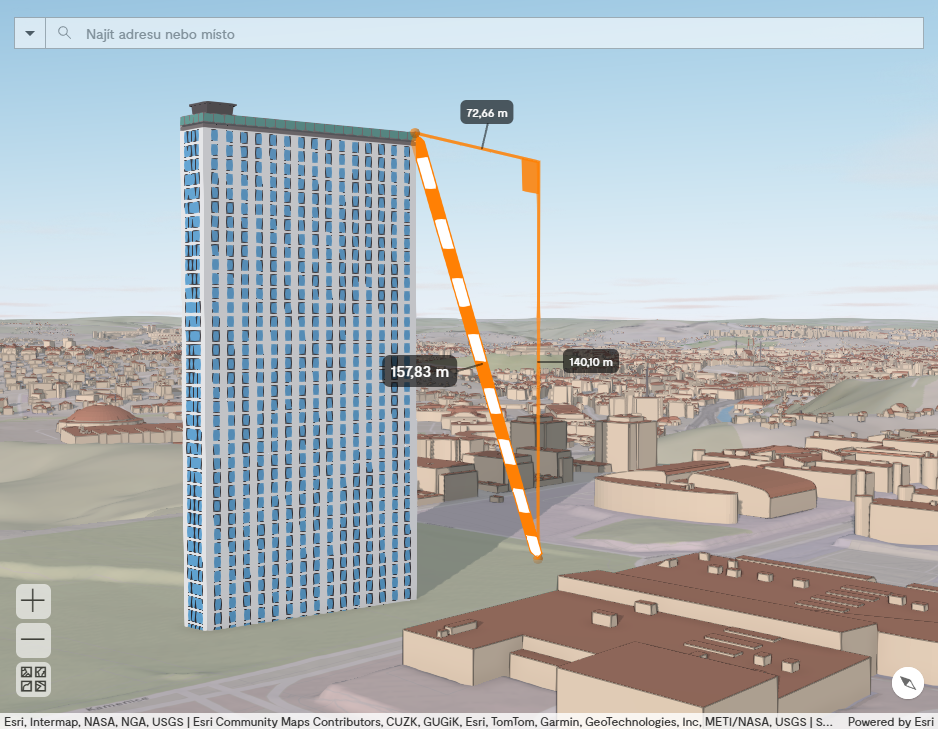
Measure Distance
This tool can measure a horizontal or vertical (height) distance, as well as a diagonal one. Just launch the tool with click on New measurement (Pic. 27), next click in the scene for start point and again for end point (Pic. 30). Reset the tool by click again on New measurement.
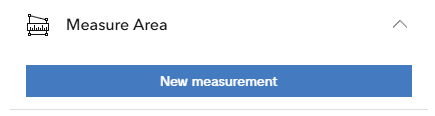
Measure Area
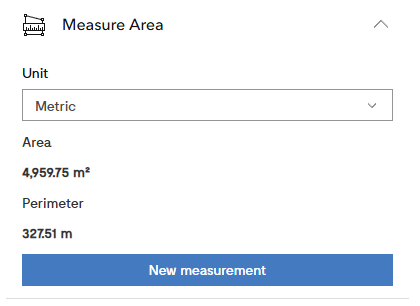
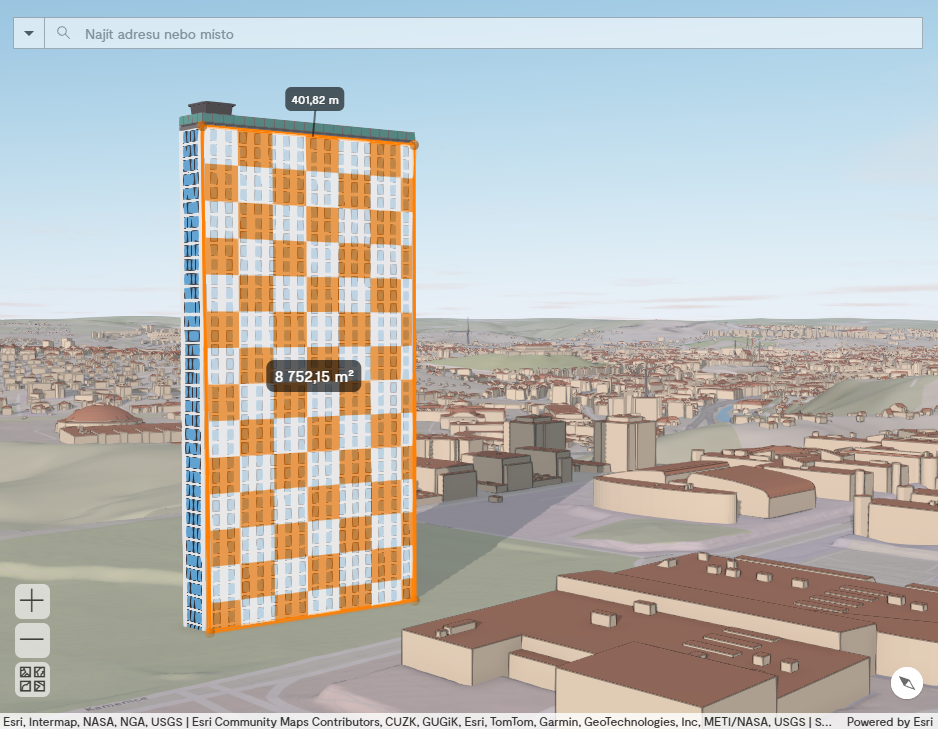
This tool can measure an area and a perimeter of any element in the web scene. Just add by clicks three or more points and the calculation is performed (Pic. 34).
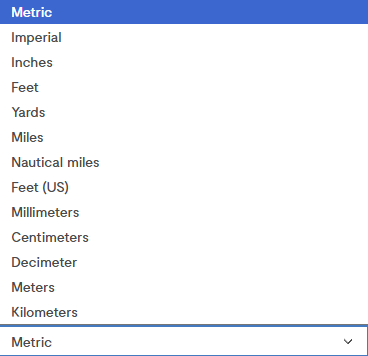
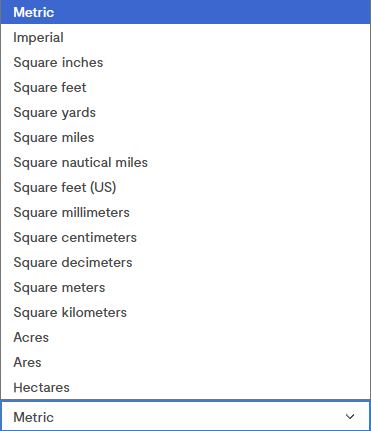
You can see the area and the perimeter in the tool (Pic. 32).You can change the units of the measurement as well (Pic. 32, Pic. 33)
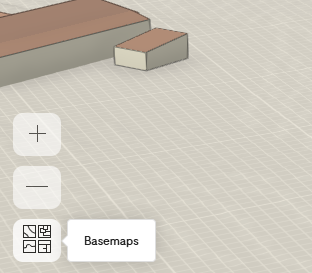
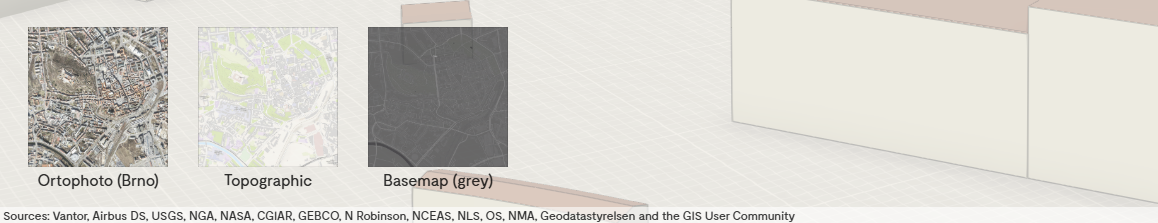
Basemaps
Click on the icon of basemaps in a lower left corner and various basemaps choices appears. Clicking on any of them (Ortophoto, Topographic or Basemap – grey) will change the basemap.