Basemaps
Layers
Tools
Move the map with the left mouse button. The right button changes the map’s orientation. The “Reset Compass Orientation” icon returns the map’s orientation to default.
Basemaps
Layers
Tools
Moving tooltip
Select by polygon
Unselect
Click on the “Moving tooltip” tool.
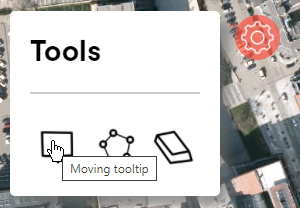
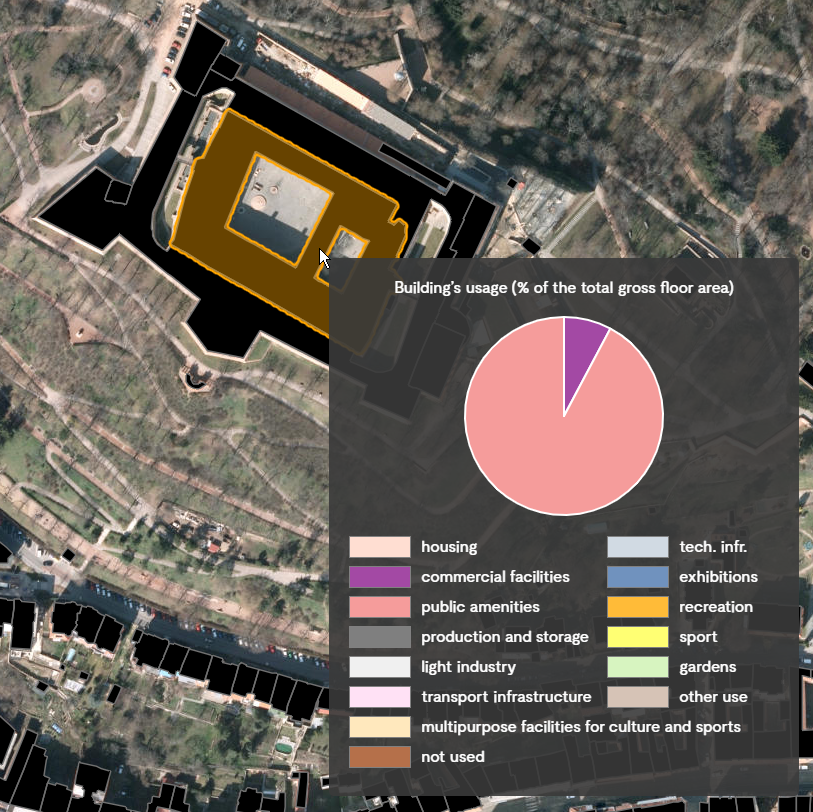
When you mouse over any building (or tap on it when using mobile devices), a pie chart will be displayed.
Click on the “Select by polygon” tool.
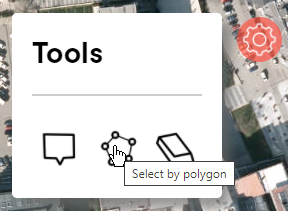
Select the site of interest by clicking the left mouse button (or by tapping when using mobile devices) in the map window and thus select the break points.
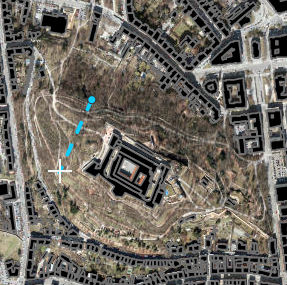
Confirm the selection by double-clicking or tapping again on the first break point of the selection, or by pressing the C key.
The predominant usage of the building is defined by the function with the largest share in the total gross floor area. The usage of the first above-ground floor then shows its main function, or the most common combination of two functions (if they each occupy roughly half of the floor area).
The result is two types of depiction of the functional structure of the city, which differ mainly in the intensity of the direct relationship to the surrounding public space. While information on the predominant usage of a building is essential for the assessment of the overall gross floor area statistics, the usage of the first floor is crucial for the assessment of the parterre, which is part of the public space of streets and squares.
The ability to display the predominant usage is thus suitable for analyses of the functional structure of the city, city districts or blocks, which are the basis for evaluating the potential and preferred use of development sites. Knowing the usage of the first floor makes it possible to identify basic spatial patterns of civic amenities, such as city streets with a commercial parterre (shops, services), the attractiveness of the parterre of residential areas, or areas without a typical parterre (e.g. campuses).
Data on the physical structure of buildings are valuable both for calculating the gross floor area and evaluating the volumes and areas of existing buildings, as well as for evaluating the urban structure and creating 3D visualisations of the city.
Analyses of the “roof” landscape and the number of floors are essential especially for setting the height zoning of the city or assessing the suitability of individual construction plans in terms of the relationship to the nature of the surrounding buildings. Information about the type of roof and the number of floors can be further used to refine the city’s 3D model.
To determine the height of a building, it is possible to use an approach that allows you to identify the absolute heights of selected segments or edges of individual buildings. Unlike the number of floors, this method uses the focus of individual objects in space in combination with a digital terrain model and digital surface model.
The height of the buildings, specifically the height of the outer edges, was used to characterise the height urban structure. In the vast majority of cases, the outer edges of buildings represent the eaves of buildings. The resulting lines on the buildings are thus defined as outer edges.
A digital terrain model and digital surface model (developed by TOPGIS in 2019) were used to obtain data on the height of the outer edges. The lowest altitude on the line was taken from the digital terrain model, whereas the maximum altitude was taken from the digital surface model. The relative height of the outer edges was calculated from the difference in values. The relative height calculated in this way has its limitations and may not correspond to reality, especially in areas where there is greenery near the buildings, which exceeds the height of the buildings.
The relative height of the outer edges is a basic set of data that is used in the practice of spatial planning. The eaves segment with the given heights serves as the basis for evaluating the height urban structure of the city. The data are used in the Planning analytical materials of the city of Brno, allowing them to be used, for example, to evaluate the relationship between the height of buildings, urban structure and population density or describe the perceived landscape scene.
From a spatial point of view, the building height structure corresponds to the historical development of the city. Higher buildings are concentrated in the area of the organic urban forms, i.e. the historic centre and the inner city centre. This area is followed by the wider centre, where the block structure is less clear (mix of apartment buildings and single-family houses) and there the height of buildings is mostly reduced.
Areas with a concentration of high-rise development are typical for housing estates arising in the period of complex housing construction (e.g. Bohunice, Starý and Nový Lískovec, Lesná, Bystrc, Vinohrady, Líšeň). Nowadays, a typical image of the city’s height structure is created mostly by the local occurrences of prefabricated apartment buildings surrounding the compact urban forms of the wider centre.
Low-rise buildings are concentrated mainly in residential (e.g. Žlutý kopec, Černá Pole) and the original working-class districts of the wider centre (e.g. Židenice) and also in peripherally located, formerly rural, settlements that were joined to Brno (e.g. Bosonohy, Tuřany, Líšeň, Soběšice). From the beginning, the low-rise character of suburbanisation in the outskirts of the city was gradually supplemented by medium-high construction of apartment buildings (e.g. Bystrc – Kamechy, Panorama; Slatina – Kigginsova; Královo Pole – Sadová; Medlánky – V Újezdech).
The application displays the functional use of buildings in a 3D view in the map window and offers statistics and data analysis according to the selected criteria in the bar located on the right side. This is a pilot part of the project showing the historic city centre.
The unit is not synonymous with a floor, it can form part of a floor or the whole floor. The unit is defined mainly because one floor may have several functions. The floor is then divided into two or more units according to how many functions it serves. At the same time, the unit is based on the modelled shape of the building, where even a floor with one function can be divided into more units due to the different geometry of parts of the building. Through the pop-up it is possible to comment on the functional use of the unit.
Statistics for the entire displayed data set are displayed when “Selection: Citywide” is selected. When selecting a specific building in the map window, the statistics will be switched to the selected building – “Selection: Specific building”. Only the required data can be displayed using the “Floor selection”, “Category selection” and sliding bars of the unit area (e.g. only the housing in the 2nd floor can be displayed, etc.). The “None” tab offers basic unit statistics for a defined selection and filter, the “Usage” tab shows the structure of functional use according to the defined selection and filter, and the “Area” tab shows the structure of units according to their size categories in relation to the selection and filter.
The building model was developed on the basis of documents provided by the Brno City Council. Specifically, it is based on the basic 3D city model of Brno from 2017 (level of detail 1), the polygon layer of buildings from the Map of the Topographical Situation (2018), the Digital Surface Model (2019) and the Digital Terrain Model (2019). The 3D Basemaps solution developed by ESRI was used to create the model itself, which was then fine-tuned manually. An algorithm was created to create the floors. Although the 3D model also shows the shapes of the roofs, the given parameters of the building are only indicative and may not correspond to reality. Information on the use of individual floors was obtained from a survey of buildings, which was carried out by the Brno City Chief Architect’s Office in 2018-2020. The application was created on the basis of the c-through project.
The application displays the functional use of buildings in a 3D view in the map window and offers statistics and data analysis according to the selected criteria in the bar located on the right side. This is a pilot part of the project showing the historic city centre.
Use the icons () to activate the analytics toolbars with statistics.
The unit is not synonymous with a floor, it can form part of a floor or the whole floor. The unit is defined mainly because one floor may have several functions. The floor is then divided into two or more units according to how many functions it serves. At the same time, the unit is based on the modelled shape of the building, where even a floor with one function can be divided into more units due to the different geometry of parts of the building. Through the pop-up it is possible to comment on the functional use of the unit.
Statistics for the entire displayed data set are displayed when “Selection: Citywide” is selected. When selecting a specific building in the map window, the statistics will be switched to the selected building – “Selection: Specific building”. Only the required data can be displayed using the “Floor selection”, “Category selection” and sliding bars of the unit area (e.g. only the housing in the 2nd floor can be displayed, etc.). The “None” tab offers basic unit statistics for a defined selection and filter, the “Usage” tab shows the structure of functional use according to the defined selection and filter, and the “Area” tab shows the structure of units according to their size categories in relation to the selection and filter.
The building model was developed on the basis of documents provided by the Brno City Council. Specifically, it is based on the basic 3D city model of Brno from 2017 (level of detail 1), the polygon layer of buildings from the Map of the Topographical Situation (2018), the Digital Surface Model (2019) and the Digital Terrain Model (2019). The 3D Basemaps solution developed by ESRI was used to create the model itself, which was then fine-tuned manually. An algorithm was created to create the floors. Although the 3D model also shows the shapes of the roofs, the given parameters of the building are only indicative and may not correspond to reality. Information on the use of individual floors was obtained from a survey of buildings, which was carried out by the Brno City Chief Architect’s Office in 2018-2020. The application was created on the basis of the c-through project.
Při současném přiblížení se do výsledku nezapočítávají malé budovy. Pro započtení i těchto malých budov je nutné mapové okno více přiblížit.
Building’s usage (% of the total gross floor area)
Total gross floor area:
m2
Polygon area:
ha
Building’s usage (% of the total gross floor area)
Imagery
Grey canvas
Hillshade
Transparency
| housing | |
| public amenities | |
| commercial facilities | |
| exhibitions | |
| multipurpose facility for culture and sports | |
| sport | |
| light industry | |
| production and storage | |
| technical Infrastructure | |
| transport infrastructure | |
| recreation | |
| gardens | |
| other use | |
| not used |
Transparency
| housing | |
| housing/public amenities | |
| housing/commercial facilities | |
| public amenities | |
| commercial facilities | |
| commercial facilities/public amenities | |
| commercial facilities/production and storage | |
| exhibitions | |
| multipurpose facility for culture and sports | |
| sport | |
| light industry | |
| production and storage | |
| technical Infrastructure | |
| transport infrastructure | |
| recreation | |
| gardens | |
| other use | |
| not used |
Transparency
| sloping roof | |
| used attic | |
| flat roof | |
| combination |
Transparency
| 1 - 2 | |
| 3 | |
| 4 | |
| 5 | |
| 6 | |
| 7 - 8 | |
| 9 - 12 | |
| 13 a více | |
| atypical buildings |
Transparency
| 7,00 and less | |
| 7,01 - 10,00 | |
| 10,01 - 16,00 | |
| 16,01 - 22,00 | |
| 22,01 - 28,00 | |
| 28,01 - 45 | |
| 45,00 and more |
Transparency
The Buildings of Brno web application presents the results of a survey of Brno’s buildings that took place from 2018-2020 in 2D and 3D visualisations. The survey mainly gathered information on the floor area and functional use of the buildings. The collected data affect the subsequent spatial analyses, which are the basis especially for the creation of planning analytical materials and the land-use plan.
Altogether, over 100,000 objects were mapped.
The layer of building objects may not be completely up-to-date (e.g. in places of new development). At the same time, data on usage at the level of individual buildings may deviate from reality. Therefore, the application is not used to control the functional use of specific buildings, but to analyse the gross floor areas of buildings at the scale of streets, blocks and city districts. The survey’s detailed methodology can be found HERE.
The application has been optimised for the current versions of Google Chrome and Mozilla Firefox. It is not recommended to run the application in Internet Explorer.